I am planning to finish school soon and I would like to shed some weight before moving on. I have collected a fair number of books that I will likely never use again and it would be nice to get some money for them. Sites like Amazon and eBay let you sell your book to other customers, but Amazon will also buy some of your books directly (Trade-Ins), saving you the hassle of waiting for a buyer.
Before selling, I remembered listening to a Planet Money episode about a couple of guys that tried to make money off of buying and selling used textbooks on Amazon. Their strategy was to buy books at the end of a semester when students are itching to get rid of them, and sell them to other students at the beginning of the next semester. To back up their business, they have been scraping Amazon’s website for years, keeping track of prices in order to find the optimal times to buy and sell.
I collected a few books I was willing to part with and set up a scraper in R. I am primarily interested in selling my books to Amazon, so I tracked Amazon’s Trade-In prices for these books. This was done fairly easily with Hadley Wickham’s package rvest and the Chrome extension Selector Gadget. Selector Gadget tells me that the node I’m interested in is #tradeInButton_tradeInValue. The code to do the scraping is below.
library(rvest)

urls_df = read.csv("AmazonBookURLs.csv", stringsAsFactors = FALSE, comment.char = "")
load(file = "AmazonBookPrices.RData")
price_df_temp = data.frame(Title = urls_df$Title,
                      Date = Sys.time(),
                      Price = NA_real_, stringsAsFactors = FALSE)
for (i in 1:nrow(urls_df)) {
  tradein_html = urls_df$URL[i] %>% html() %>%
    html_node("#tradeInButton_tradeInValue")
  if (is.null(tradein_html)) {
    next
  }
  price = tradein_html %>%
    html_text() %>%
    gsub("(^[[:space:]]+\\$|[[:space:]]+$)", "", .) %>%
    as.numeric()
  price_df_temp$Price[i] = price
}
price_df = rbind(price_df, price_df_temp)

save(price_df, file = "AmazonBookPrices.RData")
After manually collecting this data for less than a week, I am able to plot the trends for the eight books I am interested in selling. The plot and code are below.
library(ggplot2); theme_set(theme_bw())
library(scales)

price_df$TitleTrunc = paste0(substring(price_df$TitleTrunc, 1, 30), ifelse(nchar(price_df$Title) > 30, "...", ""))
ggplot(price_df, aes(Date, Price)) +
  geom_step() + geom_point() + facet_wrap(~ TitleTrunc, scales = "free_y") +
  scale_y_continuous(labels = dollar) + theme(axis.text.x = element_text(angle = 90, vjust = 0))
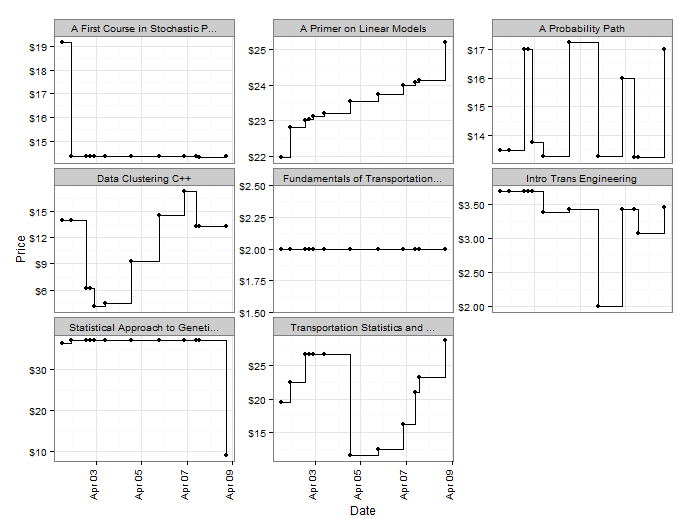
I am surprised how much the prices fluctuate. I expected them to be constant for the most part, with large changes once a week or less often. Apparently Amazon is doing quite a bit of tweaking to determine optimal price points. I would also guess that $2 is their minimum trade-in price. It looks like I missed out on my best chance to sell A First Course in Stochastic Processes, but that the price of A Primer on Linear Models will keep rising forever.